Tuesday, June 9, 2015

Does it make sense?


Through all my high school and college math classes, my teachers always taught me to step back after a problem was completed and ask if the answer made sense.  What did this mean?  It meant don't just punch numbers into the calculator, write the answer, and move on. It meant step back, review the problem, consider all the known information and ask, "Does the answer I came up with make sense?"

Take for instance the Pythagorean Theorem. Just by looking at the picture, I can see that C should be longer than A or B. If my answer for C was smaller than A or B, I would know to recheck my work.

Although the above example is relatively simple, this little trick applied to more complicated math problems, and many times it helped me catch incorrect answers.

But what does this have to do with DFIR?  I believe the same principle can be applied to investigations. When looking at data, sometimes stepping back and asking myself the question, "Does what I am looking at make sense?" has helped me locate issues I may not have otherwise caught.

I have had a least a couple of DFIR situations where using this method paid off.

You've got Mail...
I was working a case where a user had Mozilla Thunderbird for an email client. I parsed the email with some typical forensic tools and begin reviewing emails.

While reviewing the output, I noticed it seemed pretty sparse, even though the size of the profile folder was several gigs. This is where I stepped back and asked myself, does this make sense? It was a large profile, yet contained very few emails.  This led to my research and eventual blog post on the Thunderbird MBOXRD file format. Many of the programs were just parsing out the MBOX format and not the MBOXRD format, and thus, missing lots of emails. Had I just accepted the final output of the program, I would have missed a lot of data.

All your files belong to us...
Many times I will triage a system either while waiting for an image to complete, or as an alternate to taking an image. This is especially useful when dealing with remote systems that need to be looked at quickly. Exporting out the MFT and other files such as the Event Logs and Registry files results in a much smaller data set than a complete image. These artifacts can then be used to create a mini-timeline so analysis can begin immediately  (see Halan's post here for more details on creating mini-timelines).
 
To parse the MFT file into timeline format, I use a tool called Analyze MFT  to provide a bodyfile. Once the MFT is in bodyfile format, I use Harlan Carvey's parse.pl to convert it into TLN format and add it into the timeline.

While working a case, I created timelines using the above method for several dozen computers. After the timelines were created, I grepped out various malware references from these timelines. While reviewing the results, I noticed many of the malware files had a file size of zero. Weird. I took a closer look and noticed ALL the malware files contained a file size of zero. Hmmm.. what did that mean? What are the chances that ALL of those files would have a zero file size??? Since the full disk images were not available, validateing this information with the actual files was not an option. But I stepped backed and asked myself, given what I knew about my case and how the malware behaved.. does that make sense?

So I decided to "check my work" and do some testing with Analyze MFT. I created a virtual machine  with Windows XP and exported out the MFT.  I parsed the MFT with Analyze MFT and began looking at the results for files with a zero file size.

I noticed right away that all the prefetch files had a file size of zero, which is odd.  I was able to verify that the prefetch files sizes were in fact NOT zero by using other tools to parse the MFT, as well as looking at the prefetch files themselves in the VM. My testing confirmed that Analyze MFT was incorrectly reporting a file size of zero for some files.

After the testing I reached out to David Kovar, the author of Analyze MFT, to discuss the issue. I also submitted a bug to the github page.

If I had not "checked my work" and assumed that the the file size of  zero meant the files were empty, it could have led to an incorrect "answer".

So thanks to those teachers that ground the "does it make sense" check into my head, as it has proved to be a valuable tip that has helped me numerous times  (more so then the Pythagorean Theorem...)

Tuesday, April 7, 2015

Dealing with compressed vmdk files


Wherever I get vmdk files, I take a deep breath and wonder what issues might pop up with them. I recently received some vmkd files and when I viewed one of these in FTK Imager (and some other mainstream forensic tools), it showed up as the dreaded "unrecognized file system".

To verify that I had not received some corrupted files, I used the VMWares disk utility to check the partitions in the vmdk file. This tool showed two volumes, so it appeared the vmdk file was not corrupted:


When I tired to mount the vmdk file using vmware-mount, the drive mounted, but was not accessible. A review of their documentation, specifically the limitation section, pointed out that the utility could not mount compressed vmdk files:

You cannot mount a virtual disk if any of its files are encrypted, compressed, or have read-only permissions. Change these attributes before mounting the virtual disk

Bummer. It appeared I had some compressed vmdk files.

So after some Googling and research, I found a couple different ways to deal with these compressed vmdk files - at least until they are supported by the mainstream forensic tools. The first way involves converting the vmdk file, and the second way is by mounting it in Linux.

Which method I choose ultimately depend on my end goals. If I want to bring the file into one of the mainstream forensics tools, converting it into another format may work the best. If  I want to save disk space, time and do some batch processing, mounting it in Linux may be ideal.

One of the first things I do when I get an image is create a mini-timeline using fls and some of Harlan's tools. Mounting the image in Linux enables me to run these tools without the additional overhead of converting the file first.

Method 1: "Convert"

The first method is to "convert" the vmdk file.
I'm using "quotes" because my preferred method is to "convert" it right back to the vmdk file format, which in essence, decompresses it.

The vmdk file format is usually much smaller then the raw/dd image and appears to take less time time to "convert".

I used the the free VBoxManger.exe that comes with VirtualBox. This is a command line tool located under C:\Program Files\Oracle\VirtualBox. This tool give you the option to convert the compressed vmdk (or a regular vmkd) into several formats: VHD, VDI, VMDK and Raw. The syntax is:

VboxManage.exe clonehd "C:\path\to\compressed.vmkd" "C:\path\to\decompressed.vmdk" --format VMDK.

It give you a nice status indicator during the process:


Now the file is in a format that can worked with like any other normal vmdk file.

Method 2: Mount in Linux

This is the method that I prefer when dealing with LOTS of vmdk files. This method uses Virtual Box Fuse, and does not require you to decompress/convert the vmkd first.

I had a case involving over 100 of these compressed files. Imagine the overhead time involved with converting 100+ vmdk files before you can even begin to work with them. This way, I was able to write a script to mount each one in Linux, run fls to create a bodyfile, throw some of Harlan's parsers into the mix, and was able to create a 100+ mini-timelines pretty quickly.

There is some initial setup involved but once that's done, it's relatively quick and easy to access the compressed vmdk file.

I'll run though how to install Virtual Box Fuse, how to get the compressed vmkd file  mounted, then run fls on it.

1)Install VirtualBox:

sudo apt-get install virtualbox-qt

2) Install Virtual Box Fuse. It is no longer in the app repository, so you will need to download and install the .deb file - don't worry, it's pretty easy, no compiling required :)

Download the .deb from from Launchpad under "Published Versions". Once you have it downloaded, install it by typing:

sudo dpkg -i --force-depends virtualbox-fuse_4.1.18-dfsg-1ubuntu1_amd64.deb

Note  - this version is not compatible with Virtual Box v. 4.2. At the time of this writing, when I installed Virtual Box on my Ubuntu distro, it was version 4.1 and worked just fine. If you have a newer version of virtual box, it will still work - you just unpack the .deb file and run the binary without installing it. See the bottom of the thread here for more details.

3)Mount the compressed VMDK file read-only


vdfuse -r -t VMDK -f /mnt/evidence/compressed.vmdk /mnt/vmdk

This will created a device called "EntireDisk" and Parition1, Parition2 etc. under /mnt/vmdk


(even though I got this fuse error - everything seems to work just fine)

At this point and time, you can use fls to generate a bodyfile. fls is included in the Sleuth Kit, and is installed on SIFT by default. You may need to specify the offset for your partition.  Run mmls to grab this:


Now that we have the offsets, we can run fls to generate a bodyfile:

fls -r -o 2048 /mnt/vmdk/EntireDisk -m C: >> /home/sansforensics/win7-bodyfile
fls -r -o 206848 /mnt/vmdk/EntireDisk -m C: >> /home/sansforensics/win7-bodyfile


Next, if you want access to the files/folders etc, you will need to mount the EntireDisk Image as an ntfs mount for each partition. This is assuming you have an Windows system - if not, adjust the type accordingly:

Mount Partition 1, Offset 2048:


Mount Parition2, Offset 206848:


There are multiple ways to deal with this compressed format, such as using VMWare or VirtualBox GUI to import/export the compresses file... these are just some examples of a couple of ways to do it. I tend to prefer command line options so I can script out batch files if necessary.


Wednesday, March 4, 2015

USN Journal: Where have you been all my life


One of the goals of IR engagements is to locate the initial infection vector and/or patient zero. In order to determine this, timeline analysis becomes critical, as does determining when the  malware was created and/or executed on a system.

This file create time may become extremely critical if you're dealing with multiple or even hundreds of systems and trying to determine when and where the malware first made its way into the environment.

But what happens when the malware has already been remediated  by a Systems Administrator, deleted by an attacker, or new AV signatures are being pushed out, resulting in the malware being removed?

Many of the residual artifacts demonstrate execution,  however, it seems very few actually document when the file was created on the system. This is where the USN Journal recently helped me on a case. The USN Journal is by no means new.. but I just wanted to talk about a case study and share my experience with it, as I feel it's an often overlooked artifact.

For purposes of demonstrative data, I downloaded and infected a Windows 7 VM with malware.  This malware was from a phishing email that contained a zip file, voice#5734223.zip. This zip file contained a payload, voice.exe. For more details on this malware sample, check out http://malware-traffic-analysis.net/2015/01/27/index.html
 
So lets run through some typical artifacts that demonstrate execution along with the available timestamps and see what they do and don't tell us...

MFT
The MFT contains the filesystem information - Modified, Accessed and Created dates, file size etc. However, a deleted file's MFT record may be overwritten. If you're lucky, your deleted malware file will still have an entry in the MFT - however, in my case this was not to be.

The ShimCache
I won't go into to much detail here as Mandiant has a great white paper on this artifact. Basically, on most systems this artifact contains information on files that have been executed including path, file size and last modified date. I parsed this registry key with RegRipper, and located an entry for the test malware, voice.exe:

C:\Users\user1\Downloads\voice#5734223\voice.exe
ModTime: Wed Jan 28 15:28:46 2015 Z
Executed

So what does this tell me? That voice.exe was in the Downloads path, was executed, and has a last modified date of 01/28/2015 - <sigh> no create date </sigh>.
 
UserAssist
The User Assist is another awesome key... it displays the last time a file was executed, along with a run count. Once again, using RegRipper to parse this I located an entry for the test malware:

{CEBFF5CD-ACE2-4F4F-9178-9926F41749EA}
Mon Feb 23 02:33:34 2015 Z C:\Users\user1\Downloads\voice#5734223\voice.exe (2)*

By looking at this artifact, I can see that the file was executed twice - once on February 23rd, however, I don't know when the first time was. It could have been minutes, hours or days earlier. It still does very little to let me know when the file was created on the system, although I do know it should be sometime before this time stamp.

Prefetch File
This is a great artifact that can show execution and even multiple times of execution. But what if the system is a Server, where prefetching may not be enabled?  In my case, prefetching was enabled, but there was no prefetch file for the malware in question - at least that is what I thought until I checked the USN Journal. And, once again, it does not contain information related to when the file was created on the system.

Ok, so I've reviewed a couple of typical artifacts that demonstrated that the malware executed (for more artifacts related to execution, check out this blog post by Mandiant "Did it Execute") With timeline analysis, I may even get an idea of when this file was most likely introduced on the system - however, a definitive create date would be nice to have. This brings me too.....the USN Journal.

USN Journal
There are a couple of tools I use to parse the USN Journal. A quick, easy to use script is usnj.pl available from Harlan Carvey's GitHub page.

Parsing the USN Journal and looking for the malware in question, I see some interesting entries for voice.exe, highlighted in red below:


Sweeet! I now have a File_Create timestamp for voice.exe I can use in my timeline. I can also see that voice.exe was deleted relatively quickly ~ 30 seconds after it was created. This deletion occured about the same time when the prefetch file for it was created. This might be an indication that the malware deleted itself upon execution.

It's also interesting to note that around the same time the prefetch file was created for voice.exe, a file called testmem.exe was created and executed (highlighted in yellow)..hmmmm.

Time to dig deeper. For a little more detail on the USN Journal, there is the TriForce tool. This tool processes three files: $MFT, $J and $Logfile. It then cross references these three files to build out some additional relationships. In my experience, this tool takes a bit longer to run. As you can see by the output below, I now have full file paths that may help add a little more context:


That testmem.exe just became all that more suspicious due to it's location - a temp folder.

By reviewing the USN Journal file, I was able to establish a create date of the malware. This create date located in the USN Journal gave me an additional pivot point to work with. This pivot point lead to some additional findings -  a suspicious file, testmem.exe. (For some more on timeline pivoting, check out Harlan's post here). Not only did the create date help locate additional artifacts, but it can also help me home in on which systems may be patient zero. Malware may arrive on a system long before its executed.
 
Just because it's not there - doesn't mean it didn't exist. For the case I was working, I did not have any existing prefetch files for the malware. However, when I parsed the USN Journal, I saw the prefetch file for the malware get created and deleted within the span of 40 minutes. I also saw some additional temporary files get created and deleted, some of which were not in the MFT.

Alass, as sad as it is, my relationship with the USN Journal does have some shortcomings (and it's not my fault). Since it is a log file, it does "roll over" The USJ Journal can be limited in the amount of data that it holds - sometimes it seems all I see in it are Windows Update files. If a system is heavily used, and if the file was deleted months ago, it may no longer be in the USN Journal. However, all is not lost though, Rumor has it that there may be some USN Journal files located in the Volume Shadow Copies so there may still be hope. Also, David Cowen points out the log file is not circular (as I once thought), and just frees the old pages to disk:

"After talking to Troy Larson though I now understand that this behavior is due to the fact that the journal is not circular but rather pages are allocated and deallocated as the journal grows"

This means that you can carve USN Journals records! Check out his blog post here for more information.

Happy Hunting!

Additional reading on the USN Journal

http://journeyintoir.blogspot.com/2013/01/re-introducing-usnjrnl.html

http://forensicsfromthesausagefactory.blogspot.com/2010/08/usn-change-journal.html

https://msdn.microsoft.com/en-us/library/windows/desktop/aa363798%28v=vs.85%29.aspx

*The run count number was modified from 1 to 2 on this output to illustrate a point.


Tuesday, October 7, 2014

Timestomp MFT Shenanigans


I was working a case a while back and I came across some malware that had time stomping capabilities. There have been numerous posts written on how to use the MFT as a means to determine if time stomping has occurred, so I won't go into too much detail here.

Time Stomping


Time Stomping is an Anti-Forensics technique. Many times, knowing when malware arrived on a system is a question that needs to be answered. If the timestamps of the malware has been changed, ie, time stomped, this can make it difficult to identify a suspicious file as well as answer the question, "When".

Basically there are two "sets" of timestamps that are tracked in the MFT. These two "sets" are the $STANDARD_INFORMATION and $FILE_NAME. Both of these track 4 timestamps each - Modified, Access, Created and Born. Or if you prefer - Created, Last Written, Accessed and Entry Modified (To-mato, Ta-mato). The $STANDARD_INFORMATION timestamps are the ones normally viewed in Windows Explorer as well as most forensic tools.

Most time stomping tools only change the  $STANDARD_INFORMATION set. This means that by using tools that display both the $STANDARD_INFORMATION and $FILE_NAME attributes, you can compare the two sets to determine if a file may have been time stomped.  If the $STANDARD_INFORMATION predates the $FILE_NAME, it is a possible red flag (example to follow).

In my particular case, by reviewing the suspicious file's $STANDARD_INFORMATION and $FILE_NAME attributes, it was relatively easy to see that there was a mismatch, and thus, combined with other indicators, that time stomping had occurred. Below is an example of what a typical malware time stomped file looked like. As you can see, the $STANDARD_INFORMATION highlighted in red predates the $FILE_NAME dates (test data was used for demonstrative purposes)


System A \test\malware.exe

$STANDARD_INFORMATION
M: Fri Jan  1 07:08:15 2010 Z
A: Tue Oct  7 06:19:23 2014 Z
C: Tue Oct  7 06:19:23 2014 Z
B: Fri Jan  1 07:08:15 2010 Z

$FILE_NAME
M: Thu Oct  2 05:41:56 2014 Z
A: Thu Oct  2 05:41:56 2014 Z
C: Thu Oct  2 05:41:56 2014 Z
B: Thu Oct  2 05:41:56 2014 Z

However, on a couple of systems there were a few outliers where the time stomped malware $STANDARD_INFORMATION and $FILE_NAME modified and born dates matched:

System B \test\malware.exe

$STANDARD_INFORMATION
M: Fri Jan  1 07:08:15 2010 Z
A: Tue Oct  7 06:19:23 2014 Z
C: Tue Oct  7 06:19:23 2014 Z
B: Fri Jan  1 07:08:15 2010 Z

$FILE_NAME
M: Fri Jan  1 07:08:15 2010 Z
A: Thu Oct  2 05:41:56 2014 Z
C: Thu Oct  2 05:41:56 2014 Z
B: Fri Jan  1 07:08:15 2010 Z

Due to other indicators, it was pretty clear that these files were time stomped, however, I was curious to know what may have caused these dates to match, while all the others did not. In effect, it appeared that that Modified and Born dates were time stomped in both the $SI and $FN timestamps, however this was not the MO in all the other instances.

Luckily, I remembered a blog post written by Harlan Carvey where he ran various file system operations and reported the MFT and USN change journal output for these tests. I remembered that during one of his tests, some dates had been copied from the $STANDARD_INFORMATION into the $FILE_NAME attributes. A quick review of his blog post revealed the following had occurred during a rename operation . Below is a quote from Harlan's post:

"I honestly have no idea why the last accessed (A) and creation (B) dates from the $STANDARD_INFORMATION attribute would be copied into the corresponding time stamps of the $FILE_NAME attribute for a rename operation"

In my particular case it was not the accessed date and creation dates (B) that appeared to have been copied, but the modified and creation dates (B). Shoot.. not the same results as Harlan's test... but his system was Windows 7, and the system I was examining was Windows XP.  Because my system was different, I decided to follow the procedure Harlan used and do some testing on a Windows XP to see what happened when I did a file rename.

Testing


My test system was Widows XP Pro SP3 in a Virtual Box VM.  I used FTK Imager to load up the vmdk file after each test and export out the MFT record. I then parsed the MFT record with Harlan Carvey's mft.exe.

First, I created "New Text Document.txt" under My Documents. As expected, all the timestamps in both the $STANDARD_INFORMATION and $FILE_NAME were the same:

12591      FILE Seq: 1    Link: 2    0x38 4     Flags: 1  
[FILE]
.\Documents and Settings\Mari\My Documents\New Text Document.txt
    M: Thu Oct  2 23:22:05 2014 Z
    A: Thu Oct  2 23:22:05 2014 Z
    C: Thu Oct  2 23:22:05 2014 Z
    B: Thu Oct  2 23:22:05 2014 Z
  FN: NEWTEX~1.TXT  Parent Ref: 10469  Parent Seq: 1
    M: Thu Oct  2 23:22:05 2014 Z
    A: Thu Oct  2 23:22:05 2014 Z
    C: Thu Oct  2 23:22:05 2014 Z
    B: Thu Oct  2 23:22:05 2014 Z
  FN: New Text Document.txt  Parent Ref: 10469  Parent Seq: 1
    M: Thu Oct  2 23:22:05 2014 Z
    A: Thu Oct  2 23:22:05 2014 Z
    C: Thu Oct  2 23:22:05 2014 Z
    B: Thu Oct  2 23:22:05 2014 Z
[RESIDENT]


Next, I used the program SetMACE to change the $STANDARD_INFORMATION timestamps to "2010:07:29:03:30:45:789:1234" . As expected, the $STANDARD_INFORMATION changed, while the $FILE_NAME stayed the same. Once again,  this is common to see in files that have been time stomped:

12591      FILE Seq: 1    Link: 2    0x38 4     Flags: 1  
[FILE]
.\Documents and Settings\Mari\My Documents\New Text Document.txt
    M: Wed Jul 29 03:30:45 2010 Z
    A: Wed Jul 29 03:30:45 2010 Z
    C: Wed Jul 29 03:30:45 2010 Z
    B: Wed Jul 29 03:30:45 2010 Z

  FN: NEWTEX~1.TXT  Parent Ref: 10469  Parent Seq: 1
    M: Thu Oct  2 23:22:05 2014 Z
    A: Thu Oct  2 23:22:05 2014 Z
    C: Thu Oct  2 23:22:05 2014 Z
    B: Thu Oct  2 23:22:05 2014 Z
  FN: New Text Document.txt  Parent Ref: 10469  Parent Seq: 1
    M: Thu Oct  2 23:22:05 2014 Z
    A: Thu Oct  2 23:22:05 2014 Z
    C: Thu Oct  2 23:22:05 2014 Z
    B: Thu Oct  2 23:22:05 2014 Z

Next, I used the rename command via the command prompt to rename the file from New Text Document.txt to "Renamed Text Document.txt" (I know - creative naming). The interesting thing here is, unlike the Windows 7 test where two dates were copied over, all four dates were copied over from the original files $STANDARD_INFORMATION into the $FILE_NAME:

12591      FILE Seq: 1    Link: 2    0x38 6     Flags: 1  
[FILE]
.\Documents and Settings\Mari\My Documents\Renamed Text Document.txt
    M: Wed Jul 29 03:30:45 2010 Z
    A: Wed Jul 29 03:30:45 2010 Z
    C: Thu Oct  2 23:38:36 2014 Z
    B: Wed Jul 29 03:30:45 2010 Z
  FN: RENAME~1.TXT  Parent Ref: 10469  Parent Seq: 1
    M: Wed Jul 29 03:30:45 2010 Z
    A: Wed Jul 29 03:30:45 2010 Z
    C: Wed Jul 29 03:30:45 2010 Z
    B: Wed Jul 29 03:30:45 2010 Z

  FN: Renamed Text Document.txt  Parent Ref: 10469  Parent Seq: 1
    M: Wed Jul 29 03:30:45 2010 Z
    A: Wed Jul 29 03:30:45 2010 Z
    C: Wed Jul 29 03:30:45 2010 Z
    B: Wed Jul 29 03:30:45 2010 Z


Based upon my testing, a rename could have caused the 2010 dates to be the same in both the $SI and $FN attributes in my outliers. This scenario "in the wild" makes sense...the malware is dropped on the system, time stomped, then renamed to a file name that is less conspicuous on the system. This sequence of events on a Windows XP system may make it difficult to use the MFT analysis alone to identify time stomping.

So what if you run across a file where you suspect this may be the case? On Windows XP you could check the restore points change.log files. These files track changes such as file creations and renames. Once again, Mr. HC has a perl script that parses these change log files, lscl.pl. If you see a file creation and a rename, you can use the restore point as a guideline to when the file was created and renamed on the system.

You could also parse the USN change journal to see if and when the suspected file had been created and renamed. Tools such as Triforce or Harlan's usnj.pl do a great job.

If the change.log file and and journal file do not go back far enough, checking the compile date of the suspicious file with program like CFF Explorer may also help shed some light. If a program has a compile date years after the born date,.. red flag.

I don't think anything I've found is ground breaking or new. In fact,the Forensics Wiki entry on timestomp demonstrates this behavior with time stomping and moved files, but I thought I would share anyways.

Happy hunting, and may the odds be ever in your favor...


Tuesday, September 2, 2014

SQLite Deleted Data Parser - GUI Added

Last year I wrote a Python script to parse deleted data from SQLite Databases (original post here).
Every once in a while, I get emails asking for help on how to use the SQLite Parser from users who are not that familiar with using Python or command line tools in general.

As an everyday user of command line tools and  Python, I forget the little things that may challenge these users (we were all there at one point and time!) This includes things like quotes around file paths, which direction slashes go, and how to execute a python script if Python is not in your environment variable.

So, to that end, I have created a Windows GUI for the SQLite Parser to make the process a little less painful.

The GUI is pretty self explanatory:
  • Choose the path to the SQLite database
  • Choose the file to save the results to
  • Select Formatted or Raw output

This means there are now three flavors of the SQLParser available:
  • sqlparse.py - python script
  • sqlparse_CLI.exe - Windows command line tool
  • sqlparse_GUI.exe - Windows GUI tool
All three files are available for download here on on my GitHub page.

Coming soon... a blog post/tutorial on how to use python scripts :-)

Monday, July 21, 2014

Safari and iPhone Internet History Parser

Back in June, I had the opportunity to speak at the SANS DFIR Summit.  One of the great things about this conference was the ability to meet and socialize with all the attendees and presenters. While I was there, I had a chance to catch up with Sarah Edwards who teaches the Mac 518 class for SANS.

I'm always looking for new projects to work on, and she suggested a script to parse Safari Internet History. So the 4th of July long weekend rolled around and I had some spare time to devote to a project. In between the fireworks and a couple of Netflix shows (OK, maybe 10 shows), I put together a python script that parses out several plist files related to Safari Internet History: History.plist, Bookmarks.plist, TopSites.plist and Downloads.plist.

Since the iPhone also uses Safari, I decided to expand the script to parse some iPhone Safari artifacts: History.plist, Bookmarks.db and RecentSearches.plist. I imagine the iPad also contains Safari Internet History, but I did not have one at my disposal to test. If you want to send one to me for testing, I would be happy to take it off your hands :-).

In this post I'll run through each of the artifacts I located and explain how to use the script to parse out the files.

Plist Files: A love/hate relationship

First, a little background on plist files. Plist files are awesome because they can contain all sorts of information such as Internet History, Recent Docs, Network IDs etc.  There are free tools for both Windows and OS X that will allow you view the data stored in the plist file. For Windows, you can use plist Editor.  If you have a Mac, a free plist editor is included in Apple's XCode Developer Tools which can be downloaded through the App Store.

However, plist files also stink because while the plist format is standardized, it's entirely up to the programmer to store whatever they want, in whatever format they want.

A (frustrating) example of this is date information. In the Safari History.plist file the date is defined as a "String", and is stored in Mac Absolute time. Mac Absolute time is the number of seconds since June January 1, 2001.  Below is an example of this from a Safari History.plist file viewed in the XCode plist editor:

History.plist file in XCode plist editor
In the Safari Bookmarks.plist file, the date is stored in a field defined as "Date".The date is stored in a more standard format:

Bookmarks.plist file in XCode plist editor
This means that each plist file needs to reviewed manually to determine what format the data is in, and how it's stored before it can be parsed.

So, moving on to the artifacts...

Where's the beef?

On a Mac OS X, the Safari Internet History is located under the folder /Users/%USERNAME%/Library/Safari. As I mentioned before, I located four plist files in this folder containing Internet History: History.plist, Bookmarks.plist, TopSites.plist and Downloads.plist. I've written the script to read either an individual file, or the entire folder at once.

(If you're wondering about the Safari cookie files, I already wrote a separate tool support these, which can be found on my downloads page.)

History.plist
This file contains the the last visited date, URL, page title and visit count. To run the parser over this file and get a tsv file use the following syntax:

safari_parser.py --history -f  history.plist -o history-results.tsv

TopSites.plist
The Top Site feature of Safari identifies 12 Top Sites based upon how often and how recent the sites were visited. There are several ways to view the tops sites in Safari, such as starting a new tab or selecting it from the Menu>View>Top Sites. Small thumbnails of each Top Site are displayed. The user has the option to Pin or Delete a site from the Top Sites. Pinning a site keeps it in the Top Sites List, while deleting it removes it. The list can be increased to hold up to 24 sites.

The thumbnails for the webpage previews for Safari can be found under /Users/%Username%/Library/Caches/com.apple.Safari. Below is how the TopSites appear to a user ( this may vary depending on the browser version):


The TopSite.plist file contains the Page Title and URL.  It also stores values to indicate if it's a Pinned or Built in Site. Built in Sites are pre-populated sites such as iCloud or the Apple Website.

TopSites that have been deleted are tracked in the TopSites.plist as "BannedURLStrings".

To parse the TopSites.plist file use the following syntax:

safari_parser.py --topsites -f  TopSites.plist -o topsite-results.tsv

Downloads.plist
Downloads are stored in the Downloads.plist file. When a file is downloaded, an entry is made containing the following: 1)Download URL; 2)File name including the path where it was downloaded to; 3)Size of the file; 4)Number of bytes downloaded so far.  The user may clear this list at anytime by selecting "Clear" from the Downloads dialog box:


To parse the Downloads.plist file use the following syntax:

safari_parser.py --downloads -f  Downloads.plist -o download-results.tsv

Bookmarks.plist
Safari tracks three different types of bookmarks in the Bookmarks.plist file: Favorites, Bookmarks and the Reading List.

Favorites
The Bookmarks Bar (aka Favorites) is located at the top of the browser:


The Favorites are also displayed on the side bar:


Bookmark Menu
A folder titled "Bookmark Menu" is created by default when a user creates bookmarks. It contains a hierarchical structure of bookmarks and folders - these are shown in the red box below:


The user may add folders, as demonstrated with the "test bookmarks" folder below:


Reading List
The Reading List is another type of bookmark. According to Safari documentation, "Reading List helps you save webpages and links for you to read later, even when you are not connected to the internet". These items show up when the user selects the Reading List icon:


Safari downloads and stores information such as cached pages related to the Reading List under  /Users/%USERNAME%/Library/Safari/ReadingListArchives. I didn't spend too much time researching this as my parser is focused on the bookmarks.plist file, but keep it in mind as it may turn up some interesting stuff.

All three types of bookmarks (Favorites, Bookmarks and Reading Lists) are stored in the Bookmarks.plist file.

The Bookmarks.plist file tracks the Page Title and URL for the Favorites and the Bookmarks, however, the Reading List entries contain a little bit more information. The Reading Lists also contains a date added, date last fetched, fetch result, and preview text.  There are also a couple of boolean entries, Added Locally and Archived on Disk.

Out of all the plist files mentioned so far, I think this one looks the most confusing in the plist editor programs.  The parent/child relationships of the folders and sub folders can get pretty messy:


To parse the Bookmarks.plist file, use the following syntax:

safari_parser.py --bookmarks -f Bookmarks.plist -o bookmark-results.tsv

The Safari Parser will output this into a spreadsheet with the folder structure rebuilt, which is hopefully more intuitive then viewing in the plist editor:


All Four One and One for All
Instead of parsing each file individually, all four files can be parsed by pointing Safari Parser to a folder containing all four files.  This means you can export out the /Users/%Username%/Library/Safari folder and point the script at it. You could also mount the image and point it to the mounted folder. To parse the folder, use the following syntax:

safari_parser.py -d /Users/maridegrazia/Library/Safari -o /Cases/InternetHistory/Reports

This will create four tsv files with results from each of the above Internet History Files.


iPhone Internet History

Safari is also installed on the iPhone so I figured while I was at it I might as well expand the script to handle the iPhone Internet History files. I had some test data laying around, and  I was able to locate three files of interest: History.plist, Bookmarks.db and RecentSearches.plist.

While my test data came from an iPhone extraction, these types of files are also located in an iTunes backup on a computer. This means that even if you don't have access to the phone, you could get still get the Internet History. Check in the user's folder under \AppData\Roaming\Apple Computer\MobileSync\Backup, then use a tool like iphonebackupbrowser to browse the backups and export out the files:


History
The location of the History.plist file may vary depending on the model of the iPhone. Check \private\var\mobile\Library\Safari or \data\mobile\Library\Safari for this file.

Luckily, the History.plist file has the same format as the OS X version, so using the script to parse the iPhone History.plist file works the same:

safari_parser.py --history -f  history.plist -o history-results.tsv

Bookmarks
The location of the Bookmarks.db file may vary depending on the model of the iPhone. Check \private\var\mobile\Library\Safari or \data\mobile\Library\Safari for this file. On an iPhone, this file is stored in an SQLite database rather then the plist format used on OS X.  In the test data I had, I did not see any entries for the Reading List. To parse the iPhone Bookmarks.db file, use the following syntax:

safari_parser.py --iPhonebookmarks -f bookmarks.db -o bookmark-results.tsv

Recent Searches
I located a RecentSearches.plist file under the cache folder. The location of this file may vary depending on the model of the iPhone. Check \private\var\mobile\Library\Caches\Safari or \data\mobile\Library\Caches\Safari. This file contained a list of recent searches, about 20 or so. Use the following syntax to parse this file:

safari_parser.py --iPhonerecentsearches -f recentsearches.plist -o recentsearches-results.tsv

You can also point the script to a directory with all three files and parse them at once:

safari_parser.py -d /Users/maridegrazia/iPhoneFiles -o /Cases/InternetHistory/Reports

The Script

The Safari Parser can be download here. It requires the biplist library which is super easy to install (directions below). However, I've also included a complied .exe file for Windows if you don't want to hassle with installing the library. A thank you  to Harlan Carvey for suggesting the PyInstaller to compile Windows binaries for python - it worked like a charm.

To install biplist in Linux just type the following:

sudo easy_install biplist

For Windows, if you don't already have it installed, you'll need to grab the easy install utility which is included in the setup tools from python.org. The setup tools will place easy_install.exe into your Python directory in the Scripts folder. Change into this directory and run:

easy_install.exe biplist

Remember to look at the plist files to manually to verify your results. I don't have access to every past or future version of Safari or iOS. As always, just shoot me an email or tweet if you need some modifications made.

References and Tools

safari_parser.py (my script to parse the Safari Internet History)
Safari 5.1 (OS X Lion): View and customize Top Sites
Plist Editor (free plist editor for Windows)
XCode (includes free Plist Editor for OS X)
iphonebackupbrowser ( free iTunes backup browser)

Thursday, April 24, 2014

What's the Word - Thunderbird! - Parser that is....

Thunderbird is a free email client by Mozilla (similar to Outlook).  Most of the major Forensic tools support parsing this data in one way or another.  However, I recently came across a Thunderbird profile in a Volume Shadow Copy that was not getting parsed correctly, or in some instances, into a format that I needed it in.


What tipped me off that the profile was not being parsed correctly? Several things. One program I used parsed only 274 messages. Based upon the large size of the profile, this seemed suspect to me.  I tried another program and it parsed over 5,000 emails from the same profile. Quite a discrepancy. When I tried to view the profile natively using Thunderbird, it threw errors.

This caused me to take a closer look at the Thunderbird files, and untimely, write a python parser to extract the emails – including deleted ones.
  
Testing

Because the email profile was corrupted, I wanted to test the same programs with a "normal" profile. I actually use Thunderbird as my email client, so I had a decent profile for testing with over 7,000 emails in my Inbox and about 3,300 in my sent folder over the course of a couple of years.


I parsed my profile with three forensic programs as well as just viewing it in Thunderbird. I also ran the python script  I wrote over it (noted as TB Parser below). I was surprised by the variety of results - many programs were not getting all the messages. I've listed the major email folders from the Thunderbird profile below and the number of parsed emails from each program:


Tool 1 is a common "all in one" forensic tool. If you look at results from the Inbox, over 4,000 emails were parsed. If an examiner was using this as their only tool, it's easy to see how they might not even realize that an additional 3,000 messages were not parsed.

A possible reason for these discrepancy is the format in which Thunderbird stores its emails. Thunderbird uses a modified version of the MBOX email format, called MBOXRD1.This may account for the partial processing of emails as many of the tools support state support for MBOX. However, Tool 1 states in it's documentation specific support for Thunderbird.

So if the tools states support for Thunderbird, or if you see some emails but they are all not being parsed, is the tool to blame? I think it may be a little misleading that some of the emails are parsed, however,   I believe that it is incumbent upon the examiner to verify the results and understand the way that the tools work. However, that being said, sometimes it's easier said then done. I had a situation where it was pretty obvious all the emails had not been parsed. What if the profile size was 1GB and 5,000 emails were parsed? Is that a reasonable number? What if it was supposed to be 6,000 and your smoking gun is one on the ones that didn't get parsed?


Thunderbird Configuration

First, a little background information on Thunderbird. Thunderbird allows a user to set up both POP and IMAP email. Once a user has set up and configured their profile, it’s stored under the following location (at least on Windows 7):

C:\Users\%USERNAME%\AppData\Roaming\Thunderbird\Profiles\[Random].default

Unlike Outlook, the data is not stored in one file, but rather a series of files and folders under the profile directory. If you want to view this profile natively with Thunderbird, the easiest way I have found so far it to launch Thunderbird from the command prompt with the –profile switch and point it to the path where you have exported out the profile. Make sure you’re not connected to the Internet if your doing this on an evidence profile. The last thing you want to do is download new email or send out a message that has been sitting in the outbox. This may (and probably will)  modify the file, so only do it on a copy.


Once launched, a typical setup may look like this:


Of course, being forensicators, this may not be the preferred way to review emails - but sometimes it's nice or even necessary to see files in the native viewer/program.

A whole bunch of files are created under the root of the profile directory. These include files like cookies.sqlite, places.sqite and formhistory.sqlite that may warrant a peek. However, I am going to focus on the email files for now.

Email Files

Thunderbird stores the IMAP mail profile in a sub folder named "ImapMail" while POP mail and Local Folders are stored in a sub folder named "Mail":


There are several files that hold information related to emails. The first is the global-messages-db.sqlite file. This file is located in the root of the profile folder:


Global-messages.db.sqlite Database

The global-messages.db.sqlite is an SQLite database that Thunderbird uses to index and search messages.2 This file can be viewed using an SQLite Browser. The "mesagesText_Contents" table contains the Email Body, Subject, Author, Recipients and Attachment Names.

messagesText_Contents Table
While this database contains email information, the email body is not a true representation of the email. For example, the body field does not contain images or attachments. Also, it does not contain messages that have been deleted, whereas the MBOXRD file can (discussed below).  However, it does contain some useful data, such as the name of the attachments of non-deleted emails. You could browse this database quickly to see if any attachment names are suspicious. 

Using "docid" in the messagesText_Contents table, you can link it back to the “messages”table id field. The messages table contains information about each message, such as the headerMessageID and jsonAttributes. The jsonAttirbutes are what stores whether a message has been read, forwarded or replied to among other things.

 
The headerMessageID is also located in the MBOXRD file - which is what I used to link the raw MBOXRD data back to global-messages.db.sqlite database. You may noticed there is a deleted column here. Based upon limited testing, I believe that this value is used during the synching of the IMAP mail. When a message is deleted, it remains in this database with a 1 until the corresponding message is deleted on the mail sever. Once it has been deleted, the message is removed from the database, but remains in the MBOXRD file. Normally all these values will be '0' unless the user was offline when the message was deleted.


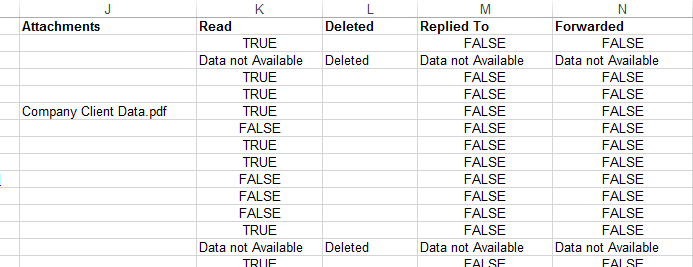
In my particular case, this sqlite file was corrupt and I did not have access to these tables.  This may also be why one of the programs did not parse the email fully - maybe it was relying on the table, who knows.  I have written my parser so that it does not need this database to process the emails. It merely displays "Data not available" for the fields that it can't pull from the table.

Just a heads up, there is more data that could be mined from this database, such as IM Conversations but I am trying to stay focused on email.. so moving on.... (and who uses Thunderbird to IM anyways????)

MBOXRD aka The Payload

Thunderbird stores email in an mbox  format called MBOXRD. Basically, it stores email in plain text MIME format. The cool thing is (based upon my testing and some internet research) when an email is deleted, it stays in this file. These deleted emails would not be seen if this profile was viewed using the Thunderbird client. The thunderbird parser pulls all the emails from these files, including deleted ones.

The MBOXRD files are stored in file that is named after the corresponding email folder with no file extension. For example, the Inbox folder stores its emails in the "INBOX" file":


One level deeper, in the .sdb folder are the other folders such as the Sent folder and any user created folders to store email:


.MSF files
 For each MBOXRD file, there is a corresponding .msf file. The .msf file contains folder indexes and preference data in Mork format. According to internet research, this file format has taken a lot of heat as being a pain to work with. The pointers for messages marked as Junk by Thunderbird appear to be tracked in here (based upon my limited testing). However, the formatting of the Message-ID's in this file are whacked. They include backslashes and if they are to long, they can also include the newline "\n" character as well.

Deleted Files
As mentioned before, when a file is deleted it is removed from the database yet still remains in the MBOXRD file.  In order to determine if a file is deleted,  the headerMessageID in the MBOXRD file can be cross referenced back to the database. However, emails that have been marked as "Junk" mail by Thunderbird are not stored in the global-messages.db.sqlite either. The "Junk" emails appear to be stored in the corresponding MBOXRD .msf file. So two checks need to be done to determine if a file has been deleted. The logic is as follows:


Thunderbird Email Parser

The python thunderbird email parser does three things:

1) Provides an Excel Sheet with the following information: file the email came from, address information (from, to, cc, bc), subject, raw date, converted date (in UTC) a link to the exported email and a list of attachments:


2) If the corresponding global-messages.db.sqlite is readable, it will provide TRUE/FALSE values for read, replied forwarded and if the message was deleted. If a message was deleted, the database format has changed, or the database is corrupt, these fields will say "Data not available".


3) It exports all the emails into a subfolder named "emails". Each email is named with the timestamp, email subject and unique number.


Normally, when I write a parser, I like to dump the output into a CSV, TSV or a plain text file.  This proved difficult for two main reasons. 

First, many of the email addresses and strings within the email body contained tabs and commas which threw the formatting off.

Second,   I needed a way to supply the body of the email. Putting a large body of an email into one cell looked ugly.  Also, html was not displayed as one would see it in an email client making it difficult to read.

For this reason, I decided to put the output into an Excel sheet. So in order to use the parser, the xlwt python libary needs to be installed which is pretty quick and easy to do for either the Windows or Linux platform. For Linux, you can use easy install. For Windows, you can downalod the installer for xlwt at https://pypi.python.org/pypi/xlwt/0.7.2

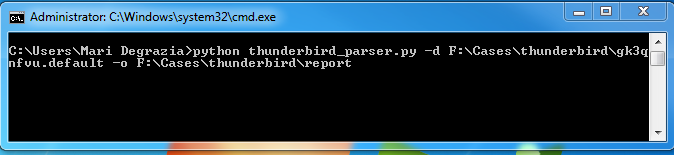
To use the parser, simply point it at the profile directory and select a directory for the output. The script will recurse through all subdirectories, so if you export out the user profile, make sure it goes in it’s own directory:


A report.xls file will be created along with a log file in output folder. The .eml files will be placed in a subdirectory named “emails”.

Some things to note, you may notice duplicate emails. This is because some emails may be stored in several folders, thus the email is stored in multiple files.  For example, an email may be in the Inbox, as well as the All Email folder.  Why not remove duplicate emails?  Well, there may be significance if you find an email has been stored in a particular folder.

I am using a built in MIME python library to parse the emails. If an email does not follow this standard, the output may not be as expected -weird characters, etc. This is why I put the file name in the Excel sheet. You can always refer back to the original MBOXRD file to verify the results.
Although I have made every effort to test this script, and to make sure it is working accurately, verify your own results - which you should be doing anyways, right? ;-)

For deleted emails, I have made the notation "Deleted (Verify)". I did this because there is not a specific flag or variable to designate that the email has been deleted. I run through several checks to located the Message-ID to determine if the file has been deleted.  It seems to be working pretty good, but I have a limited set of test data.  How can you verify if the message has been deleted?  One way would be to open the profile in Thunderbird and use Thunderbird to search for the email. If the user deleted the email, it would not show up in Thunderbird.

I have tested this on Thunderbird 24.4.0 using Windows 7 and the SIFT workstation with Python 2.7.  If you want a Python 3+ version, I like shiny things and K-cup hot chocolate.

Given the frequency Mozilla tends to update things, there is always a chance that a new version may break the code. If you run into a situation where it doesn't work on a new or older version of Thunderbird, shoot me an email and I'll see what I can do.

As always, feedback and suggestions are welcome (If you're nice about it. Otherwise it goes right in the spam folder).

Download Thunderbird email parser.

References:

 1. Library of Congress "Sustainability of Digital Formats Planning for Library of Congress Collections, MOBXRD Email Format."

2. Mozilla Foundation. "Rebuilding the Global Database"