Thursday, February 27, 2020

Detecting Lateral Movement with WinSCP

RDP is a common way for an attacker to move laterally within an environment. Forensically, when an attacker uses RDP we can use artifacts such as shellbags, link files and jumplists on the remote system to see what was accessed while the attacker was RDPed into the system.

Another way an attacker can access a system remotely is to use a program called WinSCP.  Using
WinSCP, they can browse folders and files on a remote system, copy folder and files back to the system they are currently on, and even search the remote system for files!


The scenario I am going to focus on here is one where the attacker has already compromised a system on the network, and is using WinSCP to browse to other computers on the same network. In this case, they could browse to HR systems looking for tax information, Severs looking for databases or Workstations looking for IP data. (Note - TLDR at the bottom)

Because they are not using the Windows Explorer shell, this leaves very little artifacts on what they were doing on the remote system in comparison to RDP. Basically, they get a browse for free card. They can even open up remote documents from within a WinSCP text editor.

An argument may be made that RDP is available by default on Windows systems while  FTP/SSH is not. Well, guess what. Starting with Windows 10 1809 and Sever 2019 it is part of the "optional features " that can be easily installed on Windows. In fact, a simple PowerShell command can be used to install it. And, on top of that, it automatically creates a firewall rule and adds an SSH user. How thoughtful!

powershell Add-WindowsCapability -Online -Name OpenSSH.Server~~~~0.0.1.0
powershell Start-Service sshd

And as a bonus, add the command to have the service start up automatically:
powershell Set-Service -Name sshd -StartupType 'Automatic'

It is not uncommon for an attacker to follow the below steps once they have breached a network:

1) Dump admin credentials
2) Enumerate systems to get IP addresses/Hostnames
3) Push out PowerShell scripts to all systems en-mass that do things like disable firewalls, install backdoors and disable antivirus.

It's a simple task to add in one more command to install SSH and now boom - all these systems are now accessible to connect to using WinSCP.

Oh - and did I mention that WinSCP comes with a portable version? The portable version makes it easy for an attacker to download and use. Many blog posts reference a registry key that contains settings for WinSCP. However, the portable version does not store settings there.

So - now that we know WinSCP can be used in this manner, what artifacts can we find forensically to help determine what was done on both the "staging" system and the remote systems?  I did some testing on some Windows 10 1909 machines to see what artifacts were left behind using the Portable version of WinSCP, v.5.17.

WinSCP Client System Artifacts


Most of the artifacts related to WinSCP are going to be on the host where it was run. Running WinSCP generates many of the common artifacts seen with file execution: Prefetch, shimcache, amcache, userassist etc. However, the artifacts "for the win" will be the WinSCP.ini file and the SRUM database.

WinSCP.ini file

WinSCP.ini is a text file that contains configuration settings. It will be located in the same directory as the WinSCP.exe file.  At the end of a WinSCP session, the user is promted to save their workspace:


Even without saving the wokspace, WinSCP saves valuable information in the WinSCP.ini file that can be useful to the investigation. This includes systems connected to,usernames, places on the local system where files were saved to from the remote system and the last path that was accessed on the local system. Examples of each of these configuration sections are below:

Systems connected to: 

[Configuration\CDCache]
ItSupport@169.254.249.229=412F433A2F55736572732F<SNIP>
mdegrazia@169.254.171.129=412F433A2F55736572732F<SNIP>
ITSupport@DESKTOP-PV2TN0G=412F433A2F55736572733D<SNIP>


Folders where files have been saved:

[Configuration\History\LocalTarget]
0=C:%5CUsers%5CCrashOveride%5CDocuments%5CExfil%5C*.*
1=C:%5CUsers%5CCrashOveride%5CDocuments%5CSystem3%5C*.*

Last folder opened on the local system:

[Configuration\Interface\Commander\LocalPanel]
DirViewParams=0;1|150,1;70,1;120,1;150,1;55,0;55,0;@96|5;4;0;1;2;3
StatusBar=1
DriveView=0
DriveViewHeight=100
DriveViewHeightPixelsPerInch=96
DriveViewWidth=100
DriveViewWidthPixelsPerInch=96
LastPath=C:%5CUsers%5CCrashOveride%5CDocuments%5CExfil 


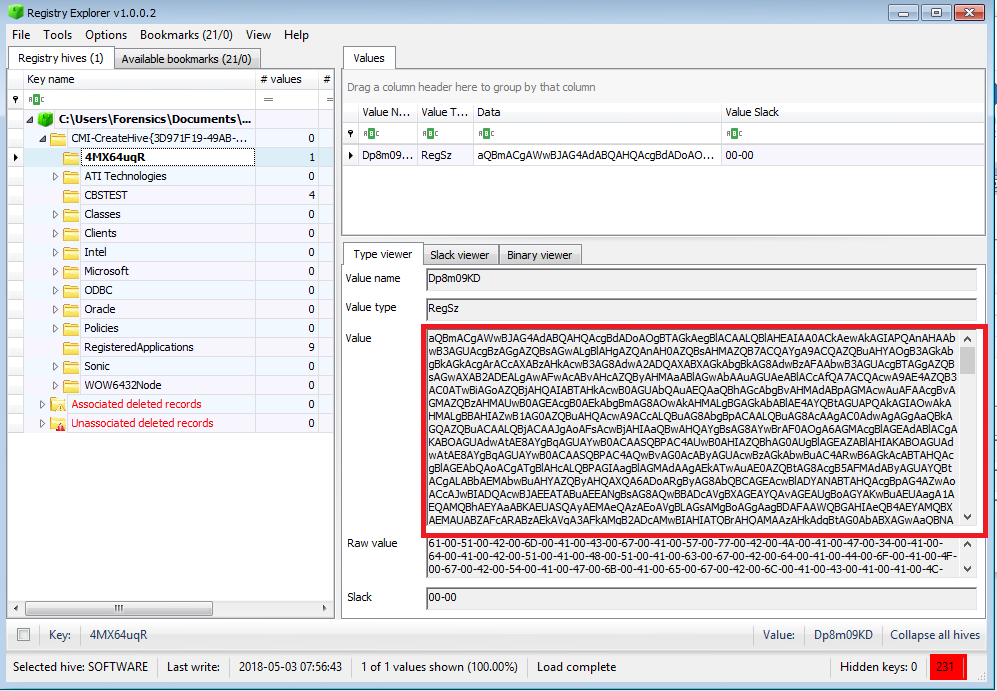
If the session settings are saved,  you get a bonus section called Sessions, with the saved session name. The default is "My Workspace" . This saves the last local directory and remote directory, along with a password. Check out https://github.com/winscp/winscp/blob/master/source/core/Security.cpp for information on the password encryption.

[Sessions\My%20Workspace/0000]
HostName=169.254.44.249
UserName=ITSupport
LocalDirectory=C:%5CUsers%5Cmdegrazia%5CDocuments%5CSystem3%5CW2s
RemoteDirectory=/C:/Users/Acid%20Burn/Documents/W2s
IsWorkspace=1
Password=A35C435B9556B1237C2DFE15080F2<TRUNCATED>

The WinSCP.ini file appears to be updated when the session closes. As such, using the last modified date of the WinSCP.ini file with a prefetch timestamp could give you an idea of how long the last session was.

As you can see by the information above, looking at this .ini file can help an examiner determine what an attacker may have been browsing to on a remote system, and what they may have saved on the local system, even if it was subsequently deleted.

SRUM Database  

The SRUM database collects information every hour on network usage on a per application basis. To get an idea of how much data may have been copied/downloaded using WinSCP it can be an excellent resource. Parsing the SRUM database with SRUM Dump by Mark Bagget shows that a high amount of data was transferred using WinSCP:


As demonstrated above, if you suspect WinSCP was used, parsing out the database can provide some details on how much data was transferred, what user account was associated with it, and the time frames that it occurred. Beautiful!


WinSCP Remote System Artifacts

There are several things you can look for on a remote system to determine if WinSCP was used to browse it: Event log entries, evidence of OpenSSH being installed and file system timestamps. Note - in my example and for my testing I installed OpenSSH which is part of Windows. WinSCP can use other FTP/SSH servers to connect to. Keep that in mind if you suspect WinSCP may have been used - your artifacts may vary.

OpenSSH artifacts

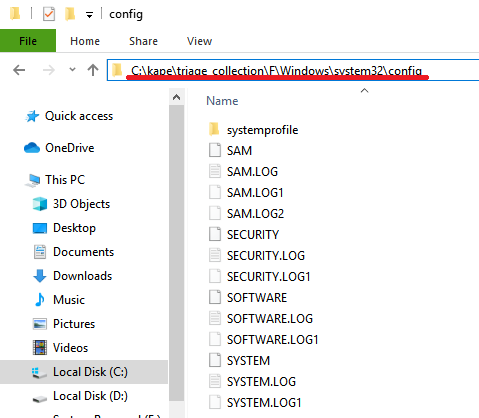
As mentioned previously, in order for WinSCP to connect to a system, an FTP or SSH sever must be running to accept the connection. Look for artifacts indicating these services exist. For OpenSSH, look for c:/Windows/System32/OpenSSH/sshd.exe, SSHD.exe prefetch files, and the sshd.exe service. Timestamps associated with these entries may help determine the first time the attacker used it to connect. When I installed OpenSSH, it also created a user account, which can be located in the SAM hive (shown here parsed with RegRipper):

Username        : sshd [1003]
SID             : S-1-5-21-1445295406-4253784506-242647837-1003
Full Name       : sshd
User Comment    :
Account Type    :
Account Created : Sun Feb 23 06:48:08 2020 Z
Name            : 
Last Login Date : Never
Pwd Reset Date  : Sun Feb 23 06:48:08 2020 Z
Pwd Fail Date   : Never
Login Count     : 0
  --> Password does not expire
  --> Normal user account


Event Log Entries

As expected there is an Event ID 4624 associated with the WinSCP client login. The login is a type 5 with the account name sshd_1860 and the domain of  VIRTUAL USERS, and the process of sshd.exe:


This is followed by an entry in the OpenSSH Operational event log that records the connecting IP address and account used by WinSCP to connect:


File Timestamps

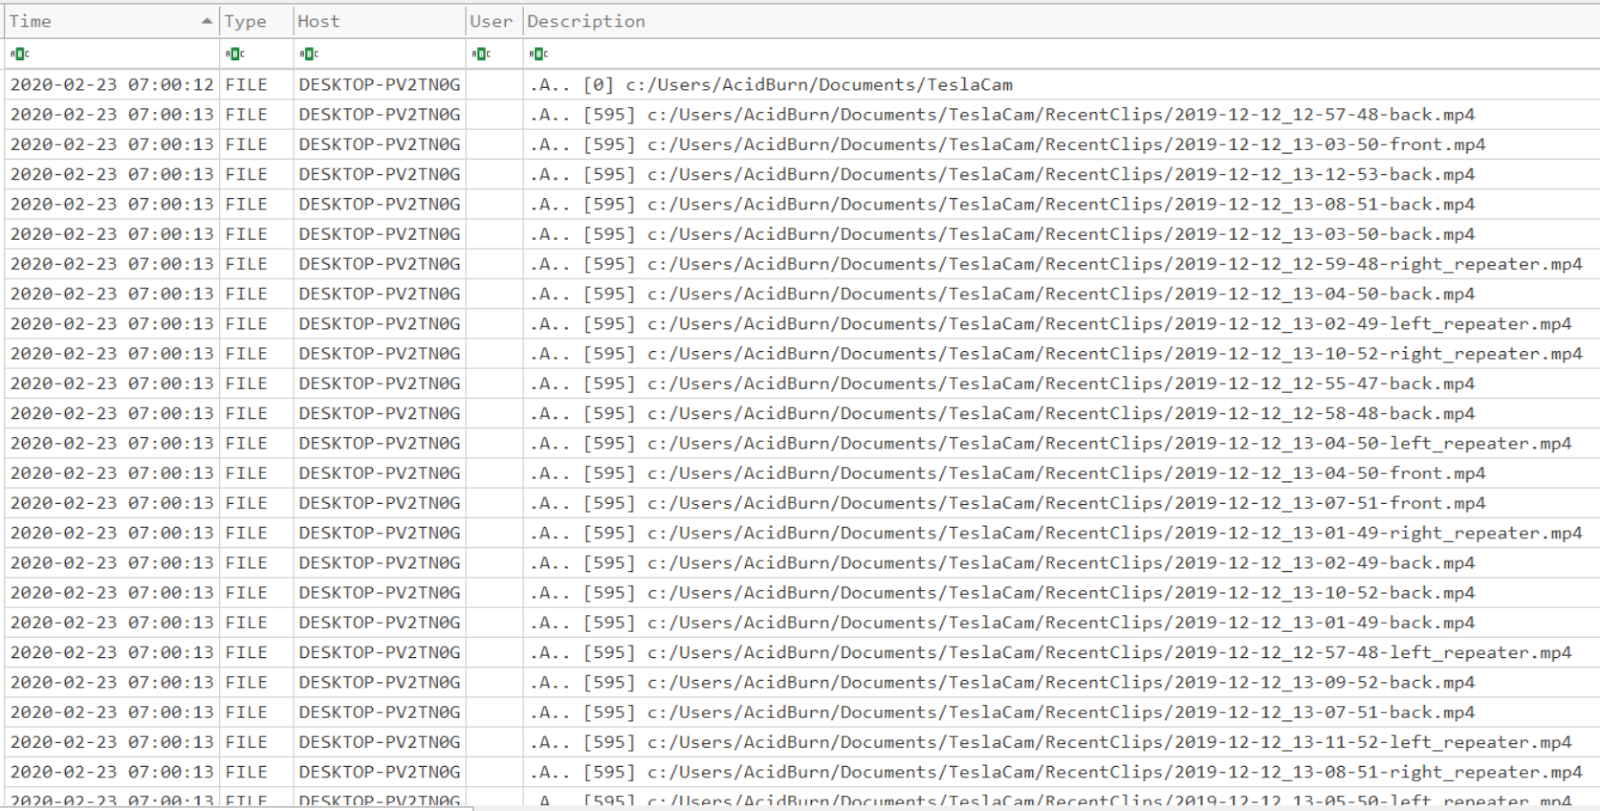
Once logged in, the attacker can use WinSCP to effectively browse through folders, and even open up files via WinSCP leaving very little trace on the remote system. During testing, I noticed that an indication this was occurring was that accessed dates were changed on folders and files clicked on or copied. However, access dates are NOT a reliable artifact to use when drawing conclusions and must be used with other corroborating artifacts.

Below is an example of files and folders that were copied. The "Teslacam" folder was copied, which results in the access dates of all the copied files to be updated on the remote system:


SRUM Database
Once again, the SRUM database really shines here to know if something is amiss. Looking at the SRUM database and sorting by "Bytes Sent" shows a large amount of data being sent during this time frame by the application sshd:


<TLDR>

So, in summary. WinSCP can be used by attackers as an alternative to RDP. The use of WinSCP to access systems in an environment appear to leave a smaller footprint than using RDP. Now that SSH can be easily installed into Windows 10 and Windows Server 2019, I anticipate we may see WinSCP being used more in network breach cases to move around laterally within the environment.

Look for the WinSCP.ini file on the host system and the SRUM datbase. For the remote system, look for Event IDs 4624 related to ssh clients/servers and Application logs for FTP/SSH severs. Check the SRUM database for data transfers related to ssh clients. Once a timeframe is known, check for large amounts of files that have last access timestamps in the same timeframe (but you know the drill with last access dates - be very careful using these)

Sources/References:

WinSCP: https://winscp.net/eng/index.php
Installing OpenSSH on Windows: https://docs.microsoft.com/en-us/windows-server/administration/openssh/openssh_install_firstuse
SRUM dump : https://github.com/MarkBaggett/srum-dump

Wednesday, August 21, 2019

Triage Collection and Timeline Generation with KAPE

As a follow up to my SANS webcast, I wanted to post detailed instructions on how to use KAPE to collect triage data and generate a mini-timeline from the data collected. As much as I hate to say "push button forensics", once you get KAPE up and running, it really is only a matter of a couple of clicks and you are off to the races.

I won't go into detail here on the benefits of collecting triage data or timelining (of which there are many!), but instead focus on how to set up KAPE to do it. If you would like more details on the above, please watch my webcast.

To get the timelining to work in KAPE you will need to do three things to get it set up. These will each be detailed in this post:

1) Download/Upgrade KAPE
2) Grab the timeline Targets and Modules if you have an older version
3) "Install" the executables called by the KAPE modules I wrote

As KAPE gets updated, I expect step #2 to drop off as it will be rolled out with the newer versions.

KAPE Basics


KAPE (Kroll Artifact Parser and Extractor) is a free tool written by Eric Zimmerman, and available for download on the Kroll website. From the website: 
"KAPE is a multi-function program that primarily: 1) collects files and 2) processes collected files with one or more programs. KAPE reads configuration files on the fly and based on their contents, collects and processes relevant files. This makes KAPE very extensible in that the program’s author does not need to be involved to add or expand functionality"
To this end, I have written a target that defines what files to collect to create a timeline, and about 20 modules that tell KAPE how to process the data - AKA - make a timeline.

In order to do this, you will need to grab the new target and timeline modules and the binary files that the modules call.

Step 1 - Download/Update KAPE

If you don't have KAPE, download KAPE from here.

If you already have KAPE, you will need to have version 0.8.6.3 or greater. To update KAPE, run the Get-KAPEUpdate.ps1 PowerShell script in the root of the KAPE directory.

Step 2 - Grab the Timeline Modules and Targets

The Targets in KAPE define what files will be collected. The Modules define what executable will be ran against the files that are collected. 

To grab the latest Targets and Module from github, run gkape.exe and click the "Synch with GitHub" at the very bottom of KAPE. This will get you the latest Targets and Modules. If you have downloaded KAPE after 8/27/2019 you can skip this step as they are included in the distro of KAPE already.


The timeline modules I created should be in the \Modules\timelining subfolder. If you do not have this folder after syncing (Eric was working on implement the syncing of module subfolders at the time of this blog post) you will need to grab the timelining folder directly from github: 

Step 3 - Grab the executables

The timelining modules will call specific executable to run against the targets. For example, if we want to parse out the eventlogs,  the program EvtxEcmd.exe is called by KAPE to parse the artifact. The executables are placed in the KAPE bin folder:


For the timeline modules, here are the executable you will need to download, and the locations where they go under the bin folder:

MFTeCmd
Purpose: Parse $MFT file
Instructions: should already be in \modules\bin. Tested with version 0.4.4.4

EvtxECmd.exe
Purpose: Parse out *.evtx event logs
Instructions: should already be in \modules\bin\EvtxECmd folder. Make sure you have version 0.5.1.0 or newer as the older version will not work for timelining.


Regripper v 2.8
Purpose: Run regripper plugins against various registry hives
Instructions: Make folder \modules\bin\regripper. Place rip.exe , "p2x5124.dll" and the plugins folder in the regripper folder:


Harlan Carvey Timeline Tools
Purpose: parse event logs, timeline registry hives, convert timeline formats, etc.
Instructions: Create the folder \modules\bin\tln_tools. Place bodyfile.exe, evtparse.exe, parse.exe, regtime.exe and p2x5124.dll in the \tln_tools folder.

Mari DeGrazia Timeline Tools
Purpose: Convert between file formats
Instructions: Place in the tln_tools folder created previously


Step 4 Generate that timeline!
Once you have the the targets,modules and executables set up, you can generate a timeline. 
First, run the Target options in KAPE to grab the triage data. This can be done on a mounted image, or an external USB drive attached to the system of interest. You could even use something like F-Response to run KAPE to do a remote collection.

Check "Use Target Options"
Target Source: The drive letter you want to collect the files from. On a mounted image, this would be the drive letter that the image is mounted as. For a live collection, this would most likely be C:
Target Destination: This would be where you want the files copied to. Most likely an external drive for a live collection, or a folder on your analysis computer for a mounted image.
Targets: Select MiniTimelineCollection
Hit execute when ready:


KAPE will now copy all the required files and place them into the Target Destination folder.

Now that the targets are collected, the modules will need to be run against the collected files. 

Select "Use Module Options"
Module Source: This will be where the files were copied to by KAPE 
Module Destination: The will be where the resulting timeline will be created
Modules: Select Mini_Timeline and if desired, Mini_Timeline_Slice_by_Daterange. The daterange will give you a smaller timeline with a specified date range.
Variables: Add two variable by using the Key and Value fields. computerName and dateRange. computerName will be the name of the system you are analyzing. The dateRange will be the dateRange you want the smaller timeline to have. This has to be in the format mm/dd/yyyy-mm/dd/yyyy.
Once completed, select execute:


After running, you will have two timelines created in CSV format. The other files created are temporary working files created during the process. These CSV files can be opened using a text editor, TimelineExplorer, Excel, or any other CSV tool of your choice. If you want some more details on how to do the timeline analysis, and where to get started with analysis of these files watch my webex towards the end. 


I highly recommend reading Harlan Carvey's blog posts on timelineing, as KAPE is just a way to automate this process.

Here is a detailed breakdown of what the timeline targets and modules I created are doing:

Targets collect the following files:
$MFT
Registy hives (SAM,SECURITY, SOFTWARE, SYSTEM, NTUSER.DAT, UsrClass.dat)
Event logs (*.evt, *.evtx)

Timeline Modules will include the following in the timeline:
File MACB timestamps
Last write times of the above registry hive's keys
ReRipper plugins ran: muicache, userassist, AppCompatCache, Services
Event Logs with Event ID and descriptions


For more detailed information on KAPE, including how to write modules and targets, check out the KAPE documentation.

Wednesday, June 13, 2018

Malicious PowerShell in the Registry: Persistence

This is the second part in my series on Finding and Decoding Malicious PowerShell Scripts. My first blog post walked through how to find malicious PowerShell scripts in the System event log, and the various steps to decode them. In this post, I wanted to discuss another location where malicious PowerShell scripts might be hiding - the Registry.

The Registry is a great place for an attacker to establish persistence. Popular locations for this are the Run keys located in either the Software Hive, or in a User's ntuser.dat hive. For a list of run keys, check out the Forensic Wiki.

A technique I've seen in some cases I've worked is an attacker using PowerShell in the Run key to call another key that contains the base64 code that contains a payload.

Let's see what an example of this looks like. Using Eric Zimmerman's Registry Explorer I've navigated to the following registry key: HKLM\Software\Microsoft\Windows\CurrentVersion\Run. Underneath the value "hztGpoWa" the following entry is made:


You can also use Harlan's RegRipper's soft_run plugin to pull this information:

rip.exe -r SOFTWARE -p soft_run

 Output:


(for the NTUSER.DAT hive, use the user_run plugin)

So what does this command do? %COMSPEC% is the system variable for cmd.exe. This uses cmd.exe to launch PowerShell in a hidden window. It then uses the PowerShell command  "Get-Item" to get another registry key - HKLM:Software\4MX64uqR, and the value Dp8m09KD under that key.

Browsing to the HKLM:Software\4MX64uqR key in Registry Explorer reveals a whole mess of base64:


Another way to pull base64 like this from the registry is to use the "sizes" plugin from RegRipper. This will search the registry hive for values over a certain threshold and dump them out:

 rip.exe -r SOFTWARE -p sizes

(A thanks to Harlan for updating this plugin! Make sure to update it if you haven't recently.)

To see the detailed steps of how to decode this base64, take a look at my earlier blog post on decoding malicious PowerShell scripts.

Here are the high-level steps to decode it:
  • Decode unicode base64 in registry key
  • Decode and decompress (gzip) embedded base64 
  • Decode another round of embedded base64
  • payload = shellcode
  • Try running scdb.exe or strings over shellcode for resulting IP address and port
The resulting code more often than not is a way to establish a Meterpreter reverse shell.

Another way to find instances of malicious PowerShell in the registry is to search the registry for "%COMSPEC%".

I used  Registry Explorer and it's handy Find command to do this. Make sure and have the right "Search in" boxes selected:


While this example showed registry keys and values with random names - this is not always the case. These names can be whatever the attacker wants and they will not always be an obvious tip off like a random name.

For my example, I used Metasploit to install this persistence mechanism in the registry. Check out all the options available. As mentioned above, the registry key/value names may be set to anything:


My next post on malicious PowerShell scripts will cover PowerShell logging and pulling information from memory. Happy Hunting!

Friday, January 5, 2018

Mounting an APFS image in Linux

As a follow up to my post on how to mount AFPS images on Windows, I wanted to post about how to mount an APFS image on a Linux system. If you are looking for how to mount an APFS image on a Mac, Sarah Edwards wrote a awesome blog post on how to do this. There is also another one over at BlackBag.If you are new to APFS, I would also recommend an informative video by Steve Whalen where he explains APFS in detail.

Options, options, options. It's always nice to have options in forensics. Sometimes one way may not work for you, or maybe you don't have access to a Mac at the moment. If you are on a Windows machine and need access to an APFS volume or image (E01 or raw), it's easy enough to spin up a Linux VM and get to work.

For my testing, I used an experimental Linux APFS driver by sgan81 - apfs-fuse. Note the word "experimental" - and read the disclaimers by the author. I would strongly recommend verifying any results with another tool or method, such as the one detailed by Sarah Edwards. However, this method works in a pinch, and at least you can start analysis until you get things working on a Mac. Oh - and according to the documentation, it will prompt you for a password if the volume is encrypted.

These instructions assume that you already have an image of the Mac, either in E01 or raw format (dd, dmg, etc). For my Linux distro, I used the free SIFT Workstation Virtual Machine on Ubutnu 16.04.  If you are using another Linux distro, you may need to install additional dependencies, etc.

Preparing the SIFT Workstation

First things first, some dependencies need to be installed before apfs-fuse will work. As always, run sudo apt-get update before installing any dependencies:

sudo apt-get update
sudo apt-get install libattr1-dev

If you are running a version of SIFT prior to the one based on Ubuntu 16.04, a couple of additional dependencies may be needed. This includes a newer version of cmake. This can be installed by following the instructions on the cmake website. In addition to cmake, older version of SIFT may also need the the ICU library:

sudo apt-get install libicu-dev


Download and build apfs-fuse

Next, download the apfs-fuse driver from github:

git clone https://github.com/sgan81/apfs-fuse

Now compile it, and install it:

cd apf-fuse
mkdir build
cd build
cmake ..
make


Mounting the E01 Image

Now that the SIFT workstation has been set up, we can mount the E01 image. If you have a dd/raw image, you can skip to the next step.

I like using the ewfmount tool in SIFT to mount E01s. Once mounted, there will be a "virtual"  raw image of the E01 file under the designated mount point. The syntax is simple, and works on split images as well (just specify the first segment for split images).

syntax:
ewfmount <image name> <mount point>
example:
ewfmount mac_image.E01 /mnt/ewf


If you have issues with ewfmount, check out this blog post for some alternative tools to mount ewf files.

Mounting the raw image to a loopback device

Now that we have a dd/raw image to work with  - either from mounting the E01, or because that is how the image was taken - we'll mount it to a loopback device. The Linux apfs-fuse driver needs the volume where the APFS container is. Because the disk image may contain additional partitions, we will need to figure out the offset where the APFS partition begins.

Below is a screen shot in X-Ways. Here was can see that X-Ways identified an APFS partition starting at sector 76,806 as well as 4096 bytes per sector (note, although X-Ways identified the partition as being APFS, it did not parse it out).


Alternatively, we can use the Sleuthkit tool mmls to list the partitions on the image. Here was can see that there is a "NoName" partition that starts right after the EFI System Partition. The offset is 76806 and is the largest partition on the drive. The Units are also displayed as 4096 bytes per sector:

To run mmls on the mounted EWF:
mmls /mnt/ewf/ewf1
To run mmls on a dd/raw image:
mmls mac_image.dd


To set up the looback device, we will need to supply the APFS starting partition offset in bytes. Since the offset is given in sectors, we will need to convert from sectors to bytes by multiplying 4096 bytes/per sector times  the number sectors:
4096 X 76806 =  314597376

Armed with this information, we can mount the "NoName" partition, aka the APFS partition, to a loopback device:

For the mounted EWF file:
losetup -r -o 314597376 /dev/loop0 /mnt/ewf/ewf1
for the dd/raw image:
losetup -r -o 314597376 /dev/loop0 mac_image.dd


In the syntax above, -r is read only, and -o is the offset in bytes to the start of the APFS partition.

Mount up the APFS filesystem

Ok! Finally! Now we are ready to mount up the APFS partition to the filesystem. The apf-fuse binary will be in a folder name "bin" within the build folder created earlier when the apfs-driver was installed. Change into that directory, and run apfs-fuse by pointing it to the loopback device and a mount point:

mkdir /mnt/apfs
./apfs-fuse /dev/loop0 /mnt/apfs


In my testing, the cursor just blinks and does not give a status message. I opened another terminal  and did an ls command on the mount point to see if it mounted ok:


Success! Now I can run AV Scans, view files, and export out any files as needed.

As I mentioned before - this is an experimental driver and all results should be verified. Hopefully as time passes we will have more ways to mount and access APFS images in Linux, and our mainstream tools.

Monday, January 1, 2018

How to mount Mac APFS images in Windows

APFS is the new file system for Mac OS, and so far, many forensic suites are playing catch up as far as support goes. As such, workarounds may need to be employed in order to conduct analysis on Mac OS APFS images. This short blog post will cover one of those workarounds -  mounting an APFS image in Windows.

Paragon has a free (preview) driver to mount APFS volumes in Windows!!!! Sweet!!!

APFS for Windows is going to look for a connected APFS drive. Since we have an image, we will need to mount the image as a SCSI device so the Windows APFS driver can see it. To do this, we will use Arsenal Image Mounter.


Mount the image using Arsenal Image Mounter. I had to select the sector size of 4096 for it to work since the sector size in my image was 4096 (If you need to know the sector size of your image, you can use a tool like mmls to check).


Download and install APFS for Windows from Paragon and launch it. It should automatically detect the APFS volume:


Now you can browse the APFS drive in Windows:


And add it to your favorite all in one tool, like X-Ways, as a logical drive:


Happy Hunting!

Monday, October 16, 2017

Finding and Decoding Malicious PowerShell Scripts


PowerShell. It's everywhere. I've started coming across more and more malicious PowerShell scripts.
Why do attackers love using PowerShell? Because it's native to many versions of Windows, provides full access to the WMI and .Net Framework and can execute malicious code in memory thereby evading AV. Oh yeah - did I mention a lack of logging too?

During the course of my analysis on these types of cases, I have found several indications that PowerShell has been utilized by an attacker. These include installed services, registry entries and PowerShell scripts on disk. If logging is enabled, that can provide some nice artifacts as well. The perspective of my post is going to be from that of an analyst that may not be too familiar with PowerShell. I am going to discuss how I locate malicious PowerShell artifacts during my analysis, as well as some methods I use to decode obfuscated PowerShell scripts. This will be Part 1 in a 3 part series written over the next few weeks.

Part 1: PowerShell Scripts Installed as Services
First up to bat is my favorite - PowerShell scripts that I find as installed services in the System event log. To find these, one of the first things I do is look for Event ID 7045. This event occurs when a service is installed on a system.  An example of a PowerShell script installed as a service is shown below:


Of note are the following red flags:

1) Random Service Name
2) The Service File Name has "%COMSPEC%", which is the environment variable for cmd.exe
3) A reference to the powershell executable
4) Base 64 encoded data

So how might an entry like this make its way into an event log? While there are various ways to do this, one method would be to use the built in Windows Service Control Manger to create a service:

sc.exe create MyService binPath=%COMSPEC% powershell.exe -nop -w hidden -encodedcommand <insertbase64>

sc start MyService

The above commands create a service named "MyService" and uses the binPath=  option to launch cmd.exe which in turns executes the PowerShell code.  

An interesting thing to note - there may be some failed errors logged after the service is created in this manner. The errors do not mean that it was unsuccessful. Windows was just expecting a "real" service binary to be installed and "times out" waiting for the "service" to report back. How do I know this? In my testing I was able to set up a successful reverse shell using the above methodology, which generated a failed service error on the Windows machine. On the left is a Metaspolit session I started on an attack virtual machine. On the right is a Windows 7 host virtual machine. Although the Windows 7 machine states "The service did not respond to the start or control request in a timely fashion," a reverse shell was still opened in the Metatsploit session:


Below are the two corresponding event log entries, 7000 and 7009, made in the System event log. Although the 7009 message states "The FakeDriver service failed to start.." this does not mean that the command inside the binPath variable did not execute successfully. So beware, interpreting these as in indication that the PowerShell did not execute may be false:


The 7045 System event log PoweShell command is encoded in base64 and python can be used to decode it. Interesting note - this base64 code is in Unicode, so there will be extra parameter specified when decoding it. (For display reasons I have truncated the base64 text - you would need to include the full base64 text to decode it):

import base64
code="JABjACAAPQAgAEAAIgAKAFsARABsAGwASQBtAHAA...."
base64.b64decode(code).decode('UTF16')

Here is what the decoded PowerShell command looks like. A quick sweep of the code reveals some telling signs - references to creating a Net Socket with the TCP protocol and an IP address:


This is similar to the type of code that Meterpreter uses to set up a reverse shell. The above PowerShell code was pretty easy to decode, however, it's usually more involved.

Next up is another example - this time its just "regular" base64. Note again the %COMSPEC% variable and reference to powershell.exe:


Again, Python can be used to decode the base64 encoded PowerShell:


This time, the decoded output is less than helpful. If we go back and take a look at the System event log entry more closely, we can see that there are references to "Gzip" and "Decompress":


Ahh.. so thinking in reverse, this data may have been compressed with Gzip then encoded using base64. Using python, I am going to write out the decoded base64 into a file so I can try unzipping it:

import base64
code="H4sICCSPh1kCADEAT..."
decoded=base64.b64decode(code)
f=open("decoded.gzip",'wb')
f.write(decoded)
f.close

Using 7zip I am successfully able to unpack the gzip file! Since I did not get any errors, I may be on the right track:


Now if I open the unzipped file with a text editor, hopefully I will see some PowerShell code:


Ahh..what??? Ok - time to take a peek in a hex editor:


Not much help either. I am thinking this may be shellcode. As a next step, I am going to run it through PDF Stream Dumper's shellcode analysis tool, scdbg.exe:


Ta-Da! scdbg.exe was able to pull out some IOCs for me from the shellcode.

To summarize, here are the steps I took took to decode this PowerShell entry:
  • Decoded the base64 PowerShell string
  • Wrote out the decoded base64 to a zip file
  • Decompressed the Gzip file using 7zip
  • Ran the binary output through scdbg.exe
As demonstrated above, there can be several layers to get though before the golds strikes.

One final example:


This looks familiar. First step, decoding the Unicode base64 gives the following result - which contains more base64 code inside the base64 code! :


Obfuscated, then obfuscated again with compression. This is very typical to what I have seen in cases. This time because there is no reference to "gzip" in the compression text, I am just going to save the second round of base64 to a regular zip file and try to open again with 7zip:

decoded2="nVPvT9swEP2ev+IUR...."
f=open("decoded2.zip,"wb")
f.write(base64.b64decode(decoded2)
f.close()

When trying to open up the zipped file with 7Zip I get an error:


And the same with the built in Window's utility:


I also tried various python libraries to unzip the compressed file. After some research, I discovered that the compression used is related to some .Net libraries. Now, since I am a python gal, I wanted to figure out how to decompress this using Python so I could easily implement it into my scripting. Since Python is cross compatible with Linux, Windows and Mac, .Net is not native to its core. As such, I used Iron Python to do my bidding. (Now yes, you could absolutely use PowerShell to decode this, but what can I say - I wanted to do it Python)

According to the Iron Python website "IronPython is an open-source implementation of the Python programming language which is tightly integrated with the .NET Framework. IronPython can use the .NET Framework and Python libraries, and other .NET languages can use Python code just as easily." Neat. Installing it on Windows is a breeze - just an MSI. Once installed, you simple run the scripts calling ipy.exe (I'll show an example later).

Armed with this, I was able to write some python code (io_decompress.py) that decompressed the zip file using the python IO compression Library:

#import required .Net libraries

from System.IO import BinaryReader, StreamReader, MemoryStream
from System.IO.Compression import CompressionMode, DeflateStream
from System import Array, Byte
from System.IO import FileStream, FileMode
from System.Text import Encoding
from System.IO import File

#functions to decompress the data
def decompress(data):
    io_zip = DeflateStream(MemoryStream(data), CompressionMode.Decompress)
    str = StreamReader(io_zip).ReadToEnd()
    io_zip.Close()
    return str

print "Decompressing stream..."
compressedBytes = File.ReadAllBytes("decoded2.zip")
decompressedString = decompress(compressedBytes)

f = open("decompressed.txt", "wb")
f.write(decompressedString)
f.close()

To run the script using IronPython was easy: ipy.exe io_decompress.py:


I was able to open the decompressed.txt file created by the script and was rewarded with the following plain text PowerShell script. Once again, note the IP address:


To summarize the steps taken for this event log entry:
  • Decoded Unicode base64
  • Decoded embedded base64 code
  • Decompressed resulting decoded base64 code
As we have seen from the three examples above, there are various techniques attackers may use to obfuscate their PowerShell entries. These may be used in various combinations, some of which I have demonstrated above. The steps taken vary for each case, and within each case itself. I usually see 2-3 variations in each case that are pushed out to hundreds of systems over the course of several months. Sometimes the steps might be:base64, base64,decompress, shellcode. It might also be: base64, decompress, base64, code, base64, shellcode. See how quickly this becomes like a Matryoshka doll? When I wrap up the series, I will talk about ways to automate the process. If you are using something like Harlan Carvy's timelines scripts to get text outputs, it becomes pretty easy.

So how to go about finding these and decoding them in your exams?

  • Look for event log ID 7045 with "%COMSPEC%, powershell.exe, -encodedcommand, -w hidden , "From Base64String" etc.
  • Look for "Gzipstream" or "[IO.Compression.CompressionMode]::Decompress" for hints on what type of compression was used
  • Try running the resulting binary files through sdbg.exe, shellcode2exe or other malware analysis tools

Part 2 will be about PowerShell in the registry, followed by Part 3 on PowerShell logging and pulling information from memory.